time-scaled schedule network diagram
ajaskaalaga võrkgraafik
olemus
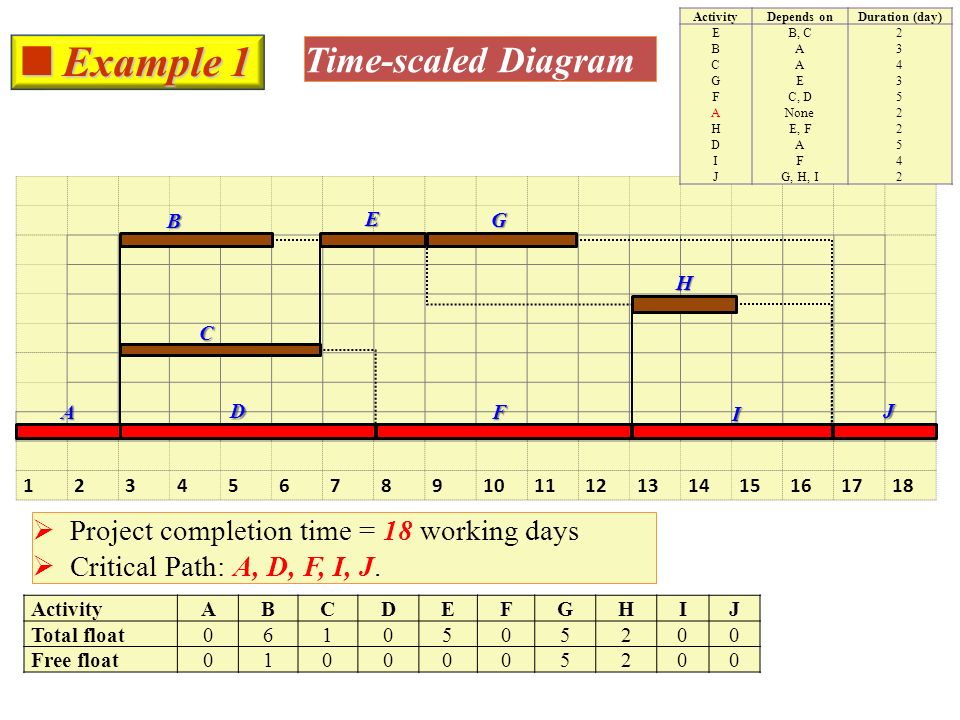
projekti võrkgraafik lintdiagrammina, millel lindid esitavad tegevusi ja
lintide pikkus tegevuste kestust
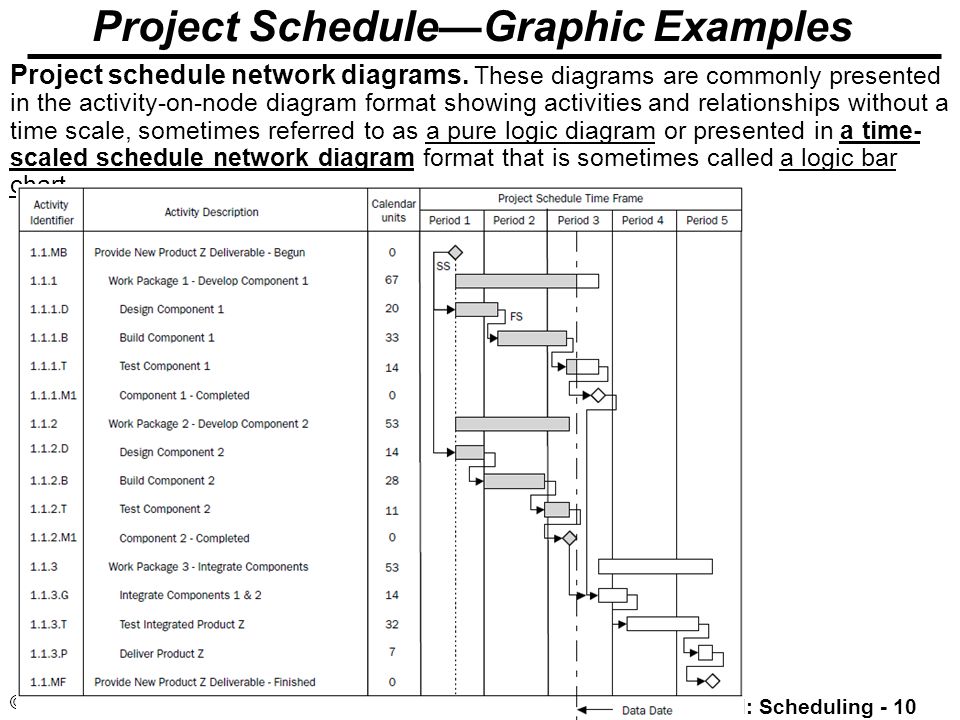
= a project schedule diagram in the form of bar chart
where bars represent activities, and the length of the bars represent activity durations
näiteid
https://images.slideplayer.com/25/7709911/slides/slide_5.jpg
http://slideplayer.com/slide/5260778/16/images/10/Project+Schedule%E2%80%94Graphic+Examples.jpg
vt ka
- ajaskaala